 |
| |
| CI Global Income & Growth Fund is a global balanced strategy that
combines a top-down investment approach with a bottom-up
delegated process. Guided by a collaborative framework for top-level
decision-making, the fund delivers a smooth, steady investment experience with downside protection. As a core solution, it tactically capitalizes on market opportunities while offering access to private markets,
making it an all-weather, long-term, one-ticket solution. |
|
 |
|
| |
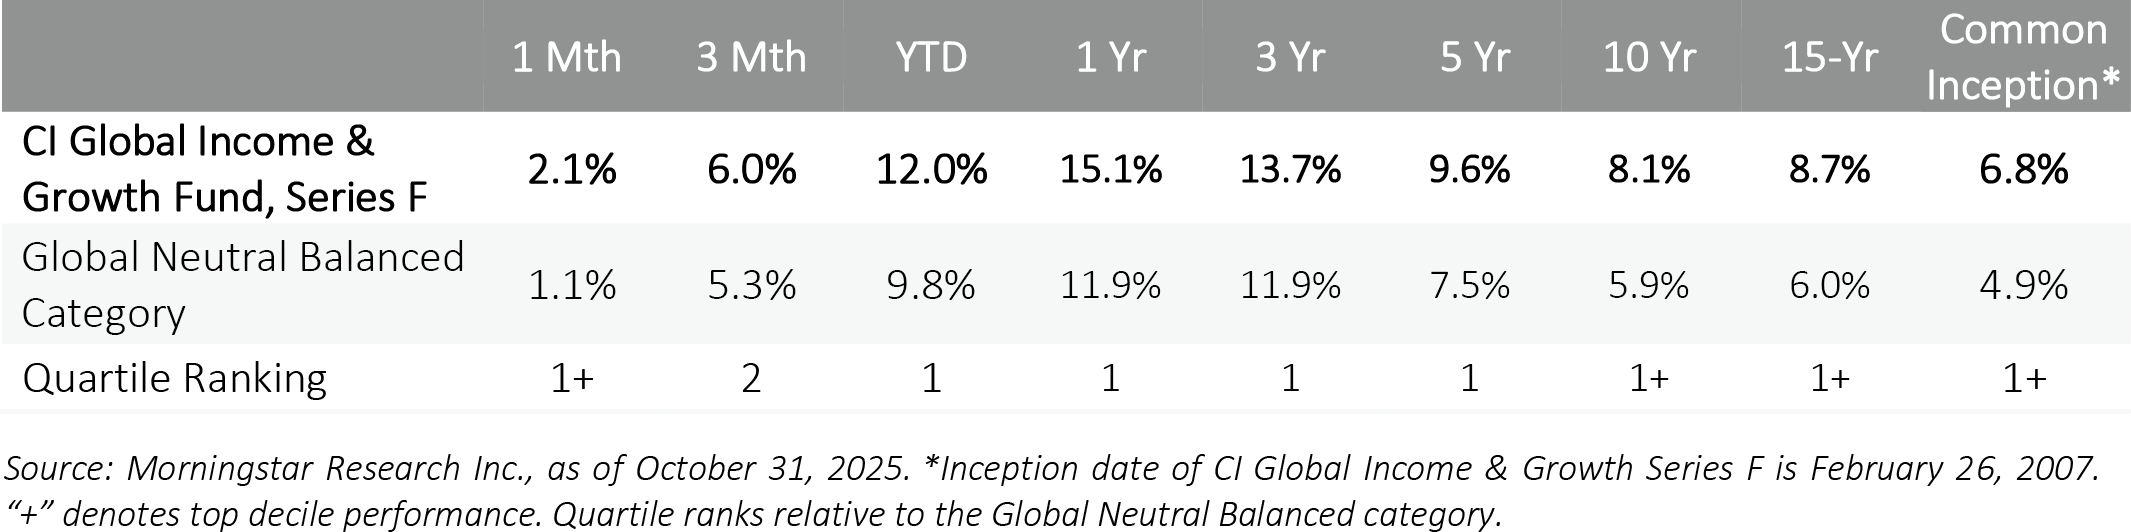
| Performance series F - as of October 31, 2025 |
| |
 |
| |
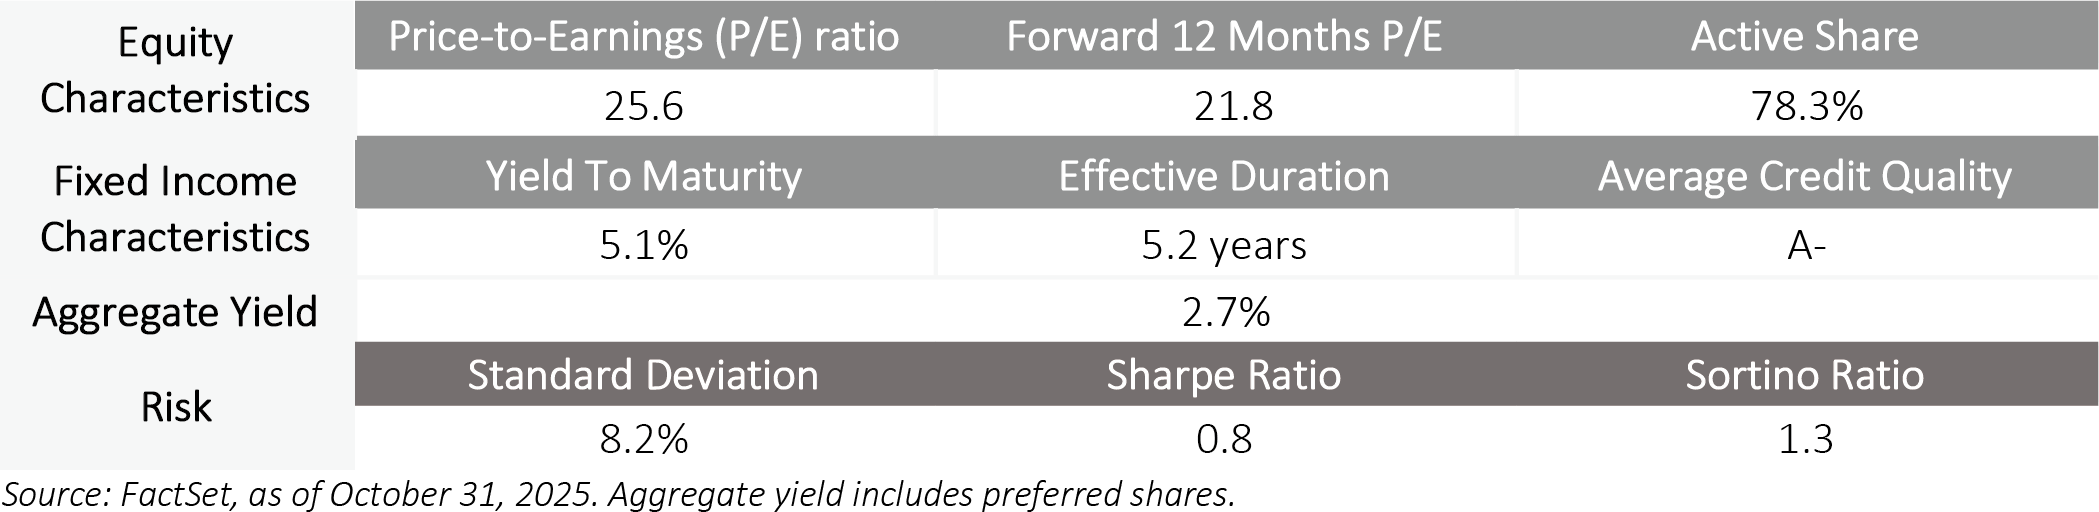
| Portfolio Statistics |
| |
 |
| |
| |
| Macroeconomic Outlook |
| |
- October saw the U.S. government shutdown delay several key economic releases, leaving market participants more reliant on private-sector data. Renewed optimism around corporate earnings helped sustain market momentum as did a constructive meeting between U.S. President Trump and Chinese President Xi toward the end of the month.
- In the U.S., private-sector data continued to suggest the labour market was soft, though not collapsing. Inflation data held steady and tariff-related pressures remained benign. The Fed eased policy further against this backdrop, though Fed Chair Powell likened policymaking to “driving in the fog”, signalling a cautious path ahead.
- The Canadian economy showed continued signs of slack, with trend employment growth soft and core inflation below the 2% target on a 3-month annualized basis. These factors contributed to the BoC’s decision to ease policy again, though communication indicated a high bar for further cuts particularly given the expected support from federal fiscal spending in the coming quarters.
- Deflationary pressures persisted in China, with producer prices continuing their multi-year decline and consumer inflation hovering around zero. Targeted stimulus measures have been introduced recently with officials hoping to sustain growth in an economy marked by weak consumption and housing activity.
- European growth remained subdued in Q3 coming in at 0.2% QoQ, though inflation remains slightly above the ECB’s 2% target. This led the ECB to hold rates steady at 2%, with policymakers citing an improved growth outlook for coming quarters, supported by infrastructure and defence spending.
|
| |
| Portfolio Positioning & performance attribution |
| |
- CI Global Income & Growth Fund Series F (the Fund) returned 2.1% during the month, outperforming the global neutral balanced category.
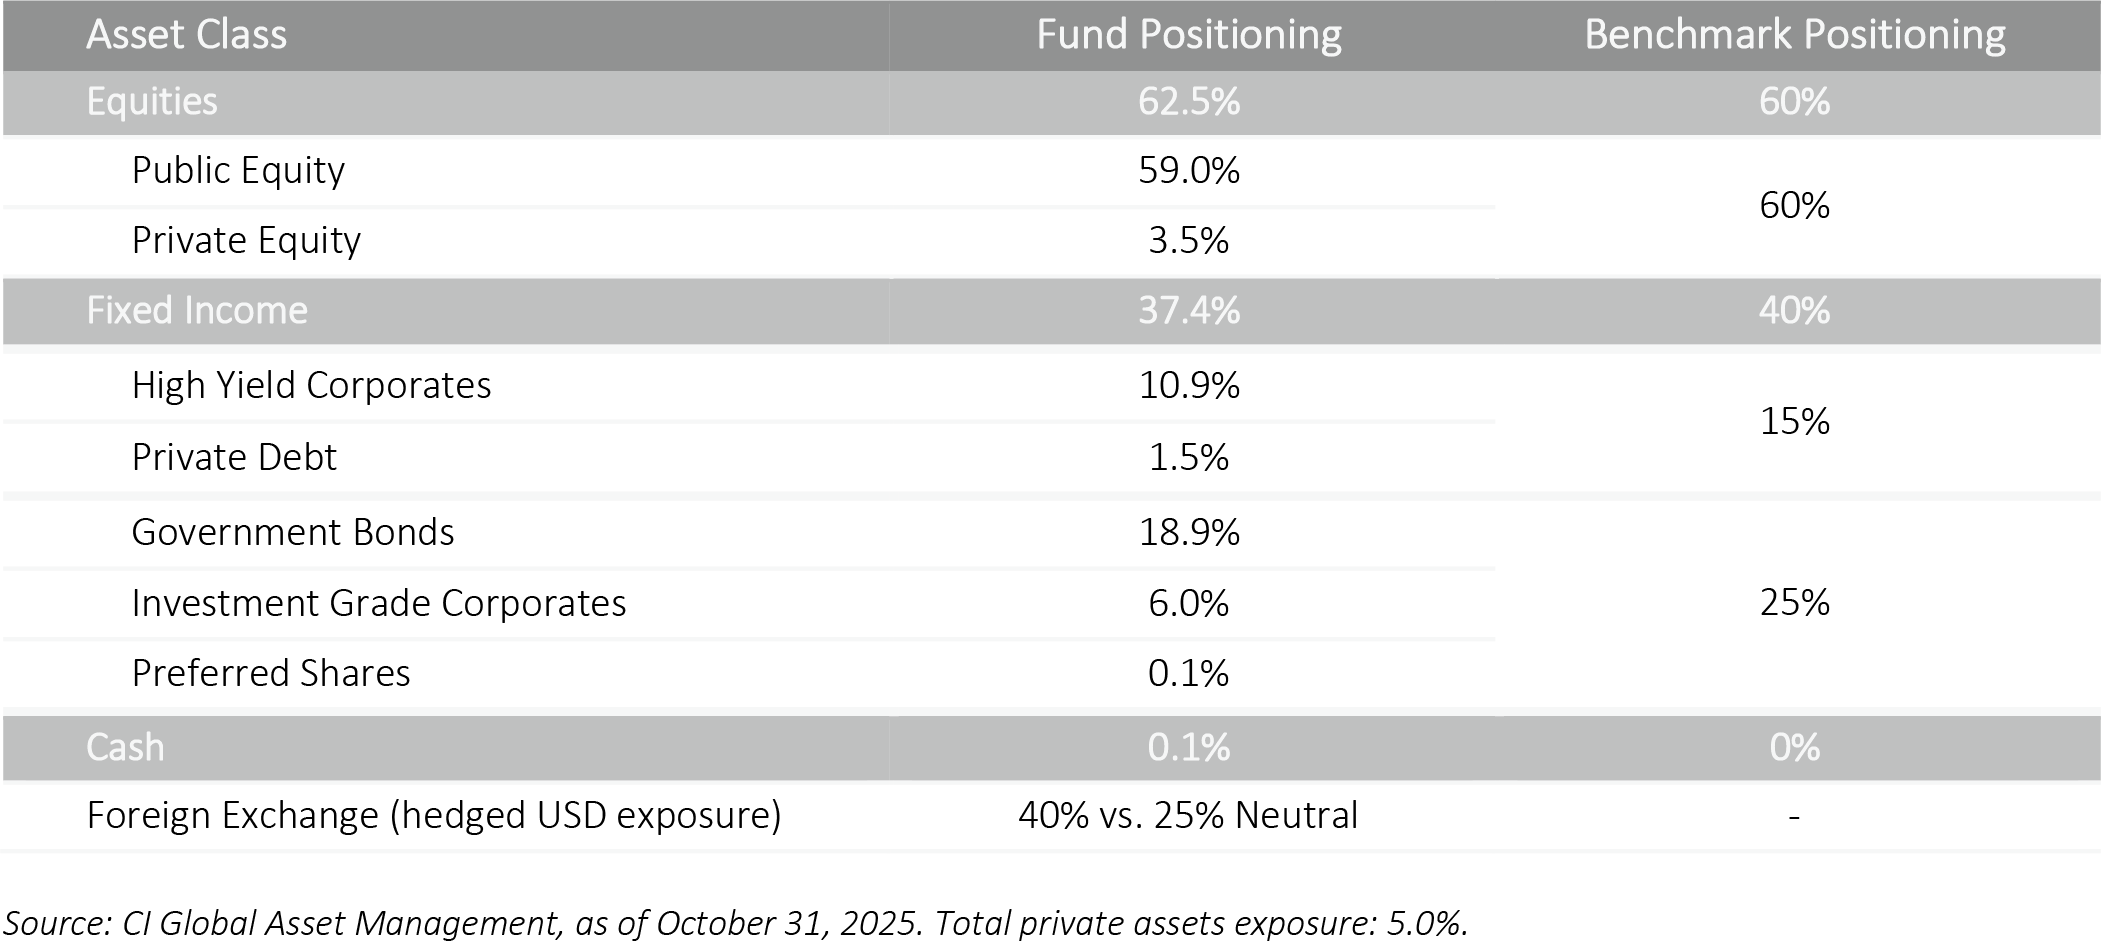
- Asset Allocation: Overall, the portfolio managers are cautiously optimistic. The portfolio is theme-driven, moving from being more defensively tilted earlier in the year towards more risk-aware positioning amid global uncertainty and two-way risks. Adjusted for private assets, the Fund maintained a neutral stance on equities and a slightly defensive bias in credit, consistent with its barbell-lite, quality-oriented approach. The U.S. economy is showing weakness in the labour market, but consumer demand remains resilient. Fiscal support from the One Big Beautiful Bill, declining interest rates, and ongoing AI-related capital investment are expected to help bridge the gap.
- Equities: Valuations across asset classes remain elevated, though the team does not anticipate a deep sell-off — volatility could be elevated. The Fund reduced its overweight to materials late in the third quarter, taking profits on Agnico Eagle, to stay aligned with its disciplined risk management philosophy. Despite this adjustment, the Fund remains overweight gold for downside protection, while maintaining diversified exposure across technology and financials to take advantage of the upside. Within financials, the team continues to focus on high-quality, large-cap names in both developed and emerging markets. The fund has also increased exposure to global defense spending.
- Fixed Income: Elevated levels of coupon payments, redemptions, and maturities have continued to support demand for credit. Net issuance has roughly matched maturities, keeping supply and demand in balance, a dynamic that is currently driving spreads tighter and yields lower. The fact that the Fed’s quantitative tightening is set to end in early December should further ease liquidity pressures and support lower yields going forward. The Fund benefited from investment-grade corporate exposure and favourable government positioning, while its underweight in high-yield credit was also additive to performance. Consistent with its quality bias, the Fund remains overweight investment-grade bonds, underweight high yield, and holds selective government exposure to preserve flexibility amid shifting rate dynamics.
- Currency & Hedging: The team remains constructive on Canada’s economic outlook, supporting a slightly higher CAD exposure. The U.S. dollar hedge ratio was gradually increased to 40% over the course of the year.
|
| |
| Asset Allocation |
| |
 |
| |
| For more information, please visit ci.com |
| |
GLOSSARY OF TERMS
Active Share: The difference between a portfolio’s holding and the benchmark index.
Derivatives: A financial security with a value that is reliant upon, or derived from, an underlying asset or group of assets. The derivative itself is a
contract between two or more parties based upon the asset or assets. Its price is determined by fluctuations in the underlying asset.
Duration: A measure of the sensitivity of the price of a fixed income investment to a change in interest rates. Duration is expressed as number of years.
The price of a bond with a longer duration would be expected to rise (fall) more than the price of a bond with lower duration when interest rates fall
(rise).
Hedging (currency): A strategy some portfolio managers use when investing in foreign securities. The goal is to fully or partially negate the impact of
exchange rate fluctuations on investment performance. An unhedged approach is often used when the portfolio manager believes exchange rate fluctuations will benefit investment performance or be neutral over time.
Return (risk-adjusted): A measure of investment performance taking into consideration how much risk/volatility was assumed to generate it. Consider
two investments, both of which return 10% over a given time period. The investment with the greater risk-adjusted return would be the one that experienced less price fluctuation. Two of the most commonly used measures of risk adjusted returns are Sharpe and Sortino ratios.
Sharpe Ratio: A risk-adjusted return measure calculated by using standard deviation and excess return to determine reward per unit of risk. The
higher the Sharpe Ratio, the better the portfolio's historical risk-adjusted performance.
Sortino ratio An evolution of the Sharpe ratio. Ignores “good volatility” (upward price movement) and focused solely on returns per unit of “bad
volatility” (downward price movement), which is more indicative of the risk of loss.
Sortino Ratio: An evolution of the Sharpe ratio. Ignores “good volatility” (upward price movement) and focused solely on returns per unit of “bad
volatility” (downward price movement), which is more indicative of the risk of loss.
Standard Deviation: A measure of risk in terms of the volatility of returns. It represents the historical level of volatility in returns over set periods. A
lower standard deviation means the returns have historically been less volatile and vice-versa. Historical volatility may not be indicative of future
volatility.
Volatility: Measures how much the price of a security, derivative, or index fluctuates. The most commonly used measure of volatility when it comes to
investment funds is standard deviation.
Yield to maturity (YTM): The total expected return from a bond when it is held until maturity – including all interest, coupon payments, and premium or
discount adjustments. |
| |
| IMPORTANT DISCLAIMERS |
| |
Commissions, trailing commissions, management fees and expenses all may be associated with mutual fund investments. Please read the prospectus
before investing. The indicated rates of return are the historical annual compounded total returns net of fees and expenses payable by the fund (except
for figures of one year or less, which are simple total returns) including changes in security value and reinvestment of all dividends/distributions and do
not take into account sales, redemption, distribution or optional charges or income taxes payable by any securityholder that would have reduced returns.
Mutual funds are not guaranteed, their values change frequently, and past performance may not be repeated.
This document is provided as a general source of information and should not be considered personal, legal, accounting, tax or investment advice, or
construed as an endorsement or recommendation of any entity or security discussed. Every effort has been made to ensure that the material contained
in this document is accurate at the time of publication. Market conditions may change which may impact the information contained in this document. All
charts and illustrations in this document are for illustrative purposes only. They are not intended to predict or project investment results. Individuals
should seek the advice of professionals, as appropriate, regarding any particular investment. Investors should consult their professional advisors prior to
implementing any changes to their investment strategies.
Certain statements contained in this communication are based in whole or in part on information provided by third parties and CI Global Asset Management Inc. has taken reasonable steps to ensure their accuracy.
Certain statements in this document are forward-looking. Forward-looking statements (“FLS”) are statements that are predictive in nature, depend upon
or refer to future events or conditions, or that include words such as “may,” “will,” “should,” “could,” “expect,” “anticipate,” “intend,” “plan,” “believe,”
or “estimate,” or other similar expressions. Statements that look forward in time or include anything other than historical information are subject to risks
and uncertainties, and actual results, actions or events could differ materially from those set forth in the FLS. FLS are not guarantees of future performance
and are by their nature based on numerous assumptions. Although the FLS contained herein are based upon what CI Global Asset Management and the
portfolio manager believe to be reasonable assumptions, neither CI Global Asset Management nor the portfolio manager can assure that actual results
will be consistent with these FLS. The reader is cautioned to consider the FLS carefully and not to place undue reliance on FLS. Unless required by applicable law, it is not undertaken, and specifically disclaimed that there is any intention or obligation to update or revise FLS, whether as a result of new
information, future events or otherwise.
The comparison presented is intended to illustrate the mutual fund’s historical performance as compared with the historical performance of widely
quoted market indices or a weighted blend of widely quoted market indices or an-other investment fund. There are various important differences that
may exist between the mutual fund and the stated indices or investment fund, that may affect the performance of each. The objectives and strategies of
the mutual fund result in holdings that do not necessarily reflect the constituents of and their weights within the comparable indices or investment fund.
Indices are unmanaged and their returns do not include any sales charges or fees. It is not possible to invest directly in market indices.
Certain names, words, titles, phrases, logos, icons, graphics, or designs in this document may constitute trade names, registered or unregistered trademarks or service marks of CI Investments Inc., its subsidiaries, or affiliates, used with permission. All other marks are the property of their respective
owners and are used with permission.
© 2025 Morningstar Research Inc. All Rights Reserved. The information contained herein: (1) is proprietary to Morningstar and/or its content providers;
(2) may not be copied or distributed; and (3) is not warranted to be accurate, complete, or timely. Neither Morningstar nor its content providers are
responsible for any damages or losses arising from any use of this information. Past performance is no guarantee of future results.
CI Global Income & Growth Fund, Series F was rated against the following numbers of Global Neutral Balanced funds over the following time periods:
1,491 funds in the past three years, 1,222 funds in the past five years and 738 funds in the past ten years. Past performance is no guarantee of future
results.
Morningstar Rating is for the F share series only; other series may have different performance characteristics.
®™2025 Morningstar and the Morningstar Rating are registered trademarks of Morningstar Research Inc. All rights reserved.
Morningstar Ratings reflect performance as September 30, 2025, and are subject to change monthly. The ratings are calculated from a fund’s three-,
five- and 10-year returns measured against 91-day Treasury bill and peer group returns. For each time period, the top 10% of the funds in a category get
five stars. The Overall Rating is a weighted combination of the three-, five- and 10-year ratings. For greater detail see www.morningstar.ca.
The Morningstar Absolute Quartile Rankings are compiled by sorting the funds by returns relative to the mutual funds within the same peer group and
range from 1 to 4 for all time periods covered and can change monthly. The top performing 25% of funds in each fund category are assigned a ranking of
1, the next 25% a 2, etc.
CI Global Asset Management is a registered business name of CI Investments Inc.
©CI Investments Inc. 2025. All rights reserved. Published November 13, 2025.
|
|
|
|
|